While there is a strong moral and political case for divestment from oil sands, there is a strong economic argument as well. Beyond the risk of fossil fuel assets becoming stranded in the future — with the most expensive assets like oil sands likely to be the first affected — oil sands stocks have also been poor performers. The authors of this site are neither professional financial analysts nor are we unbiased, however we have attempted to present the data in a transparent and neutral manner.

SOURCE: Canada: https://www.canada.ca/en/environment-climate-change/services/environmental-indicators/greenhouse-gas-emissions.html
USA: https://www.epa.gov/ghgemissions/inventory-us-greenhouse-gas-emissions-and-sinks
Japan: https://www.climatescorecard.org/2020/12/since-1990-greenhouse-gas-emissions-have-increased-by-2-7-in-japan
Italy: https://www4.unfccc.int/sites/ndcstaging/PublishedDocuments/Italy%20First/EU_NDC_Submission_December%202020.pdf
France: https://www.planete-energies.com/en/medias/close/greenhouse-gas-emissions-france
Germany: https://www.cleanenergywire.org/factsheets/germanys-greenhouse-gas-emissions-and-climate-targets
*The graphs and statistics shown below were generated before Cenovus bought Husky on March 31, 2021. MEG Energy is now among the top five oil sands producers in Canada.
3 out of the 5 big oil sands companies delivered negative returns over the last decade, while Suncor and CNRL performed on a par with the S&P/TSX Composite. All 5 of the big oil sands companies are represented in the S&P/TSX Composite, so an index that excluded them would have done better.

It is also worth noting that the Canadian stock market performed poorly over the last decade compared with international markets. The principle reason for this is the energy sector (meaning oil and gas), which the Canadian stock market is heavily weighted towards. The US stock market, in contrast, is more diversified; the results can be seen if we include the performance of the the S&P500 over the same period.

While Suncor and CNRL have been profitable over the last decade, these returns are modest at best. This can be seen if we include 4 renewable energy companies also listed on the Toronto Stock Exchange. Brookfield Renewable Partners, Northland Power, Algonquin Power and Innergex are 4 of the larger renewable companies that have been listed on the Toronto Stock Exchange for more than 10 years.

We have focussed on the 10 years until 1st January 2020 since this excludes the effect of the COVID-19 pandemic which might be considered an anomalous event, independent of the long-term viability of these companies. However, it is worth noting that the pandemic has seen the stock prices of all 5 oil sands companies at least halve. TSX/S&P Composite has fared comparatively well over the last year. The renewable energy companies’ stocks have risen over the same period.
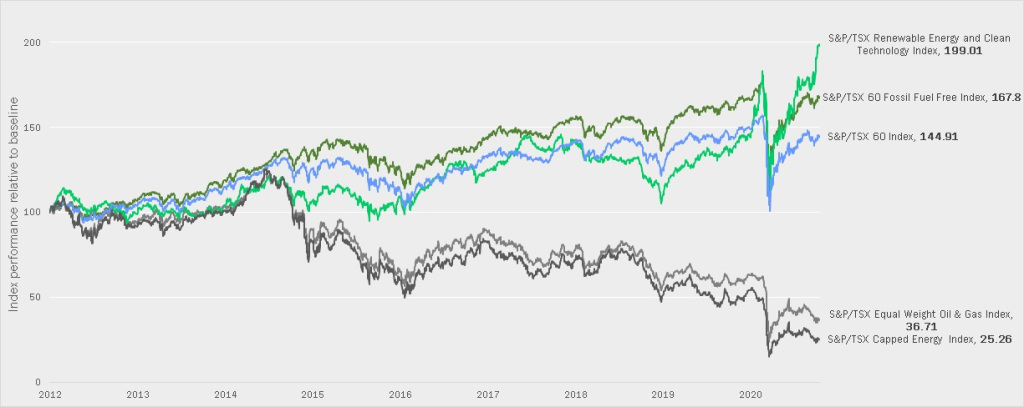
We wanted to show, in detail, the investment performance of individual oil sands companies. However, presenting investments returns on individual companies to talk about an entire sector is by its nature selective. For example, while no deliberate selection went into choosing the 4 renewable companies — since these are companies that are large now and this is a comparatively new sector — companies that did not do well over the last 10 years might not now be large. For this reason, it is also informative to compare the performance of various S&P/TSX indices.
Information about the methodology behind S&P indices can be found on this website.
A note on dividends
Much is made of the fact that oil companies regularly pay dividends. You’ll notice that all the graphs above show returns with dividends reinvested. This is the industry standard for assessing return on investment. However, it probably doesn’t reflect investor behaviour and does have the effect of magnifying the direction of travel of a stock. So if a stock has lost value over the time period, you would lose less money if you didn’t reinvest the dividends and vice versa: if the stock is positive, reinvesting it would give better returns than cash. Of course, it is not quite as simple as that, and depends on the stock price when the dividends are issued.
In the above graph you can see the impact of taking dividends as cash vs reinvesting them. If the stock price increased over the period, reinvesting is beneficial; if the price declined, the reverse is true.
*A holiday, therefore next trading day (4th January 2010)
**A holiday, therefore previous trading day (31st December 2019)